During my General Assembly Data Science Immersive program, for our first assigned project we were given the 2017 and 2018 SAT & ACT data per each of the 50 states and DC in light of the following prompt:
The new format for the SAT was released in March 2016. As an employee of the College Board - the organization that administers the SAT - you are a part of a team that tracks statewide participation and recommends where money is best spent to improve SAT participation rates. Your presentation and report should be geared toward non-technical executives with the College Board and you will use the provided data and outside research to make recommendations about how the College Board might work to increase the participation rate in a state of your choice.
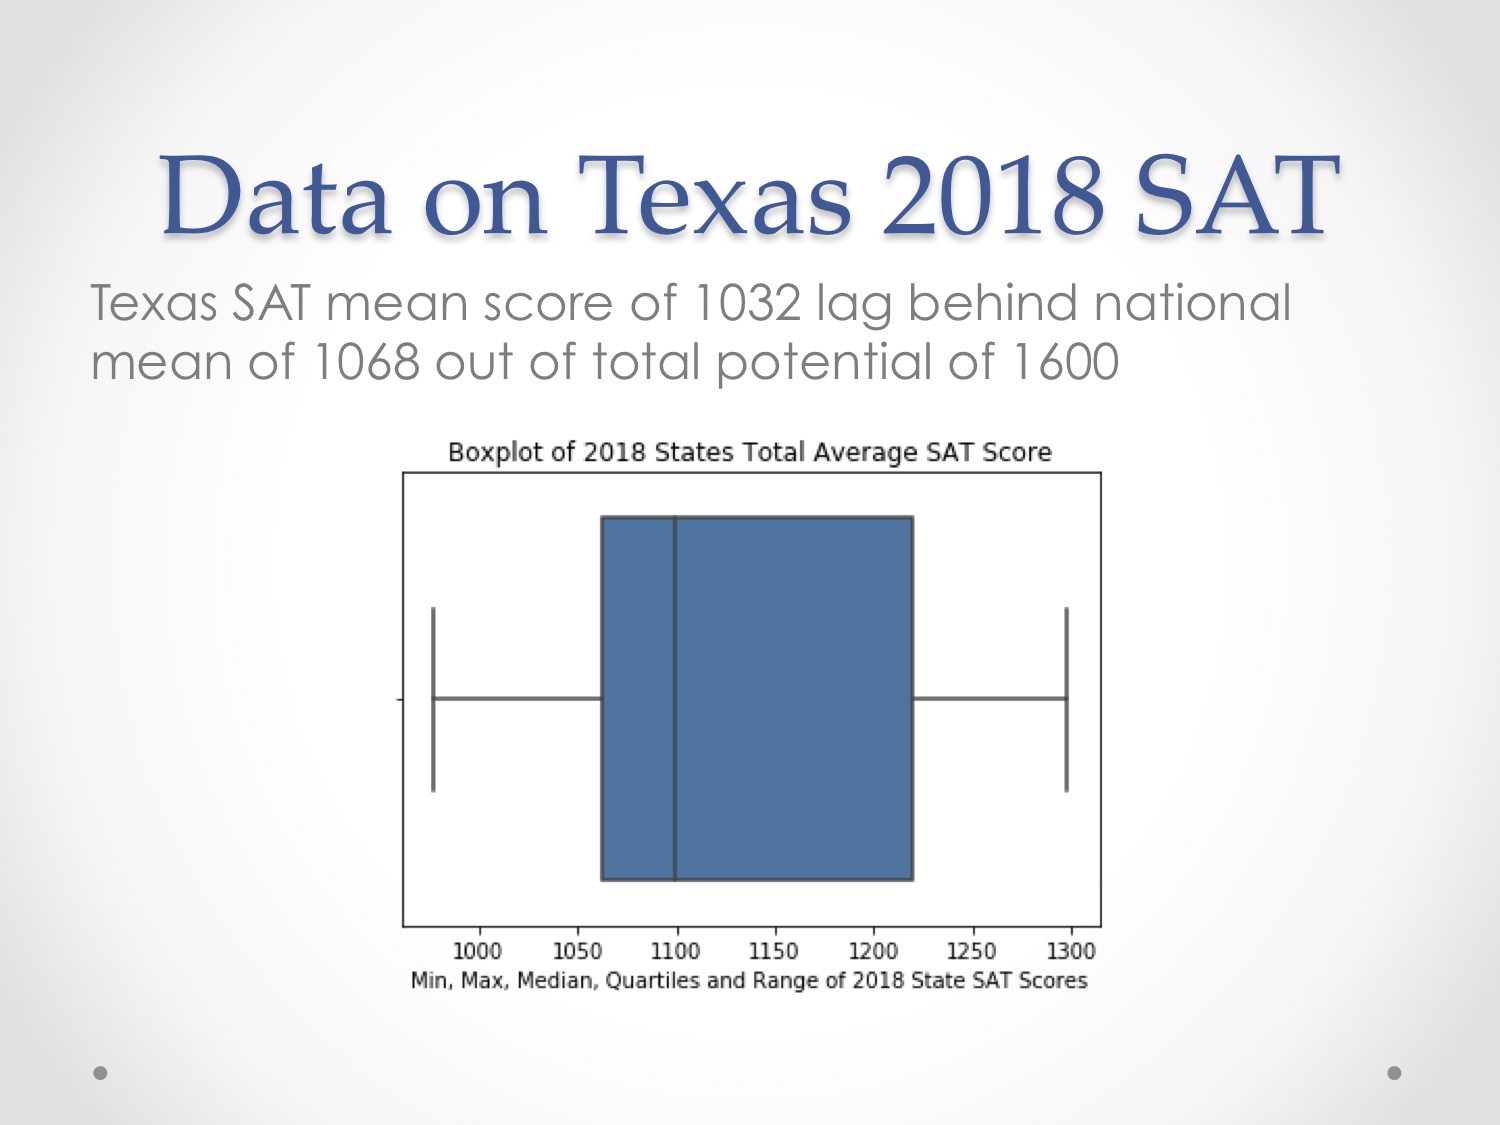
I decided to look at Texas, where I live, in light of the currently being discussed proposal to mandate either the SAT or ACT for High School students.
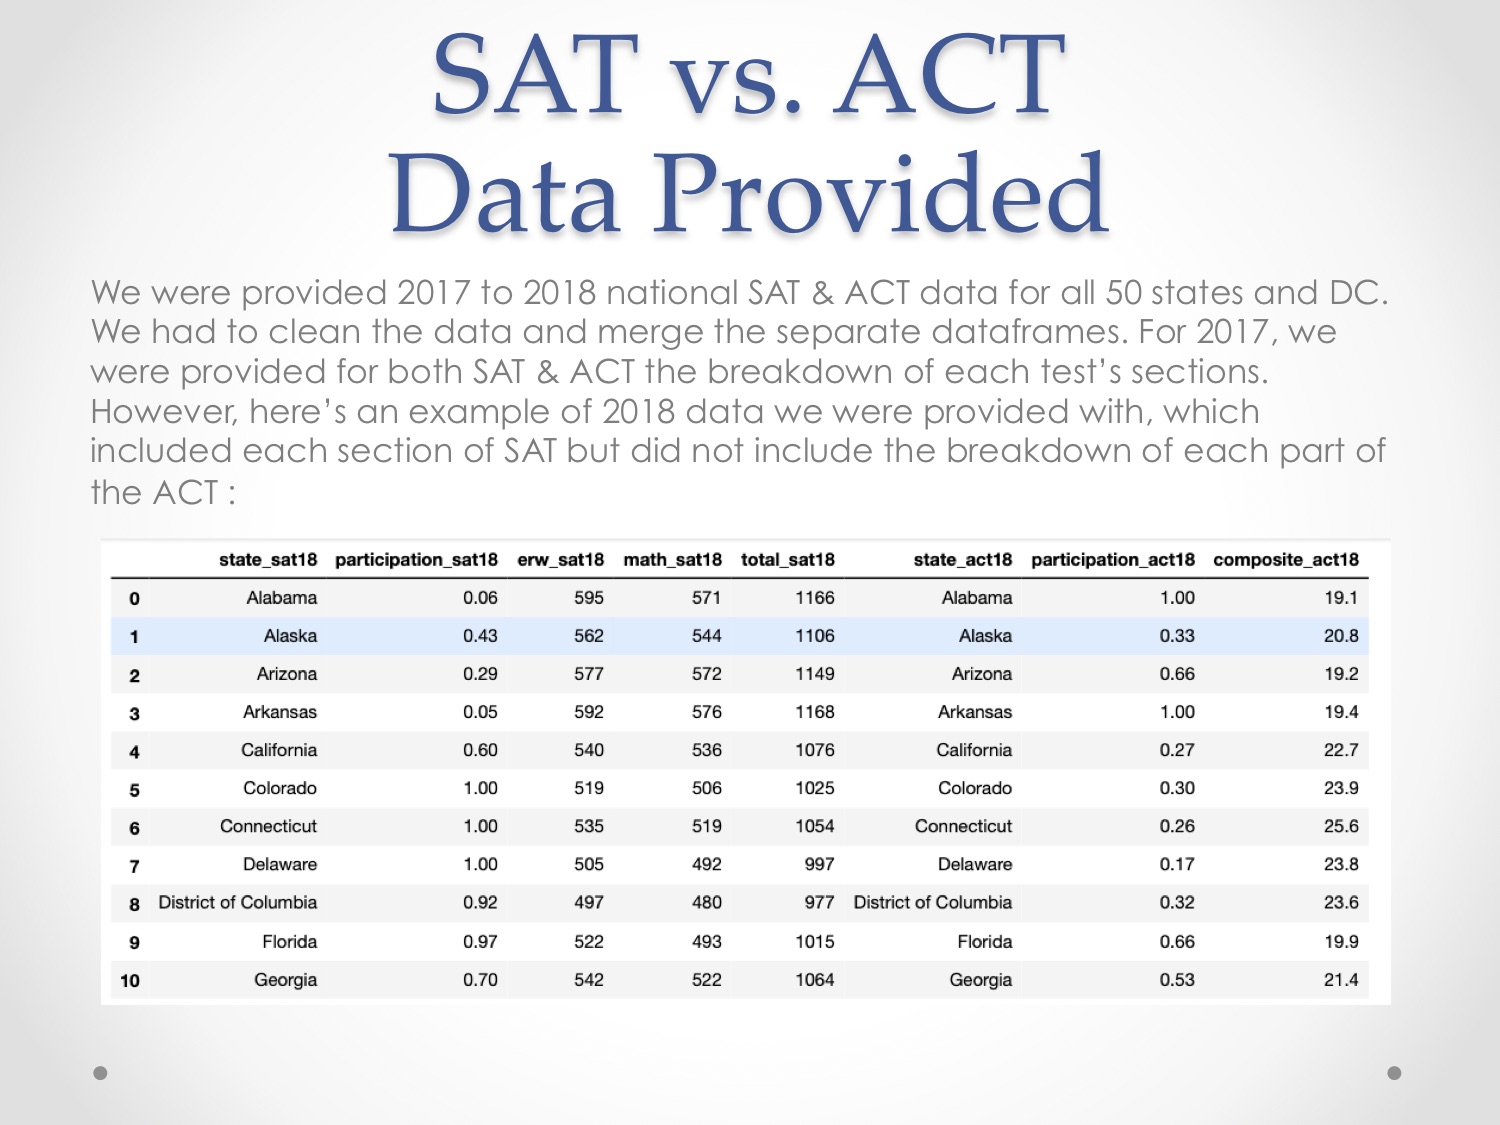
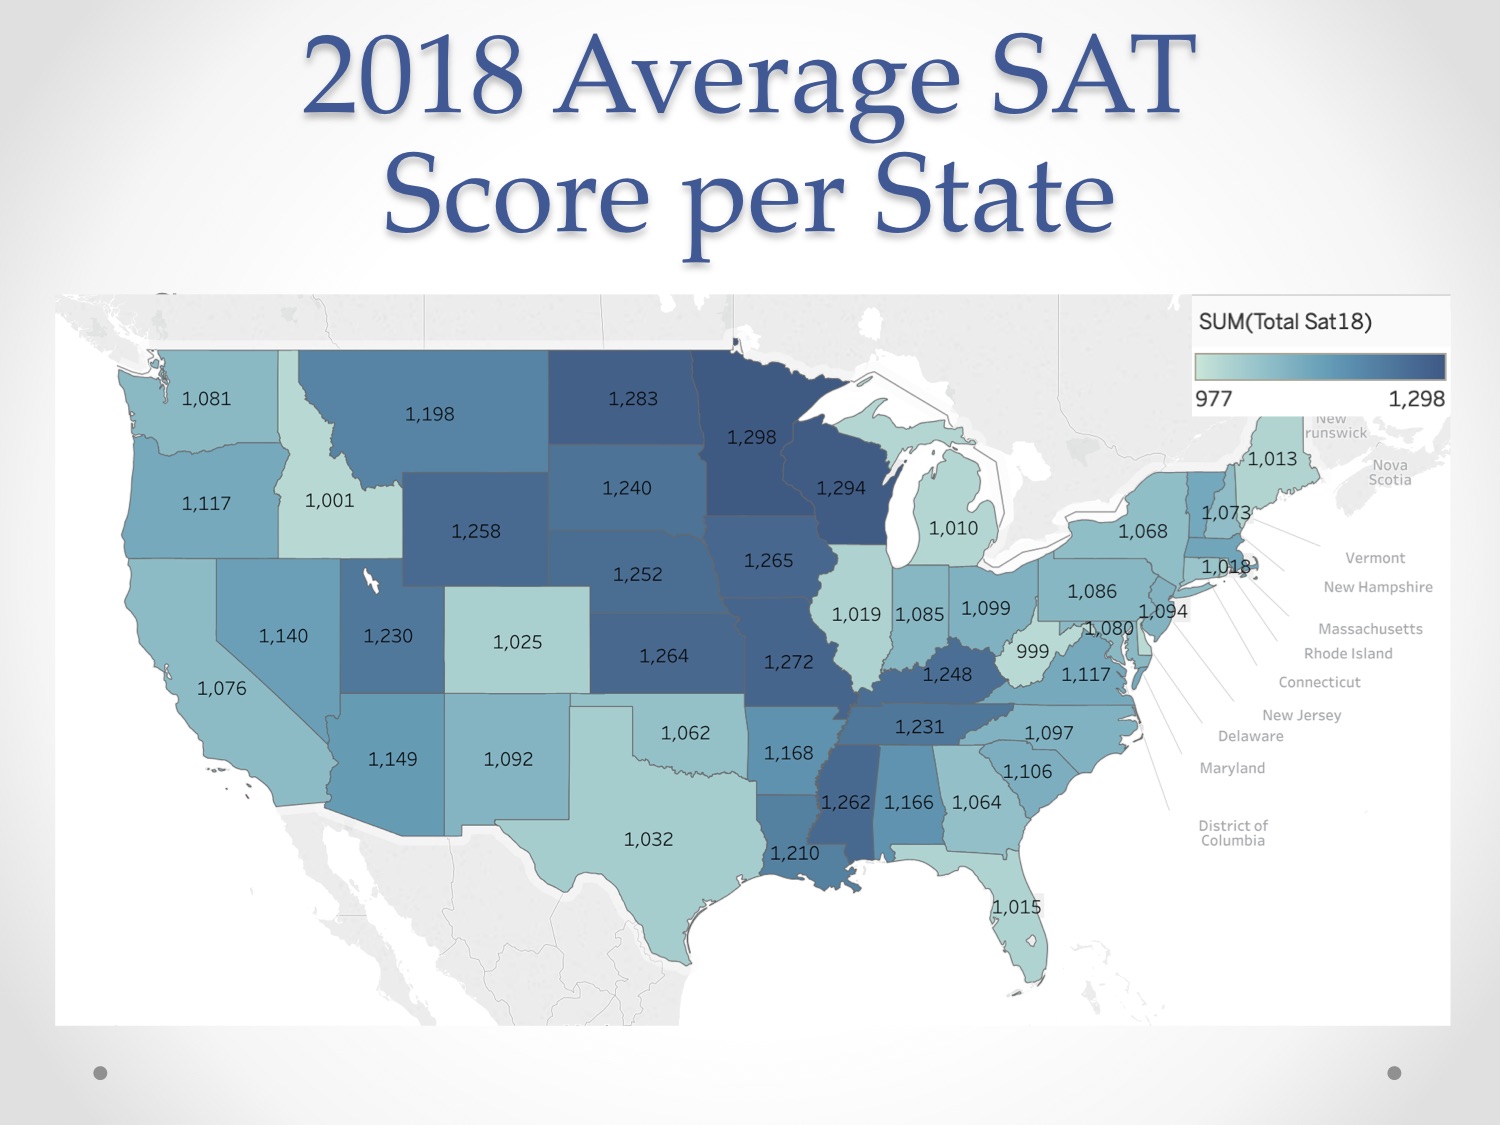
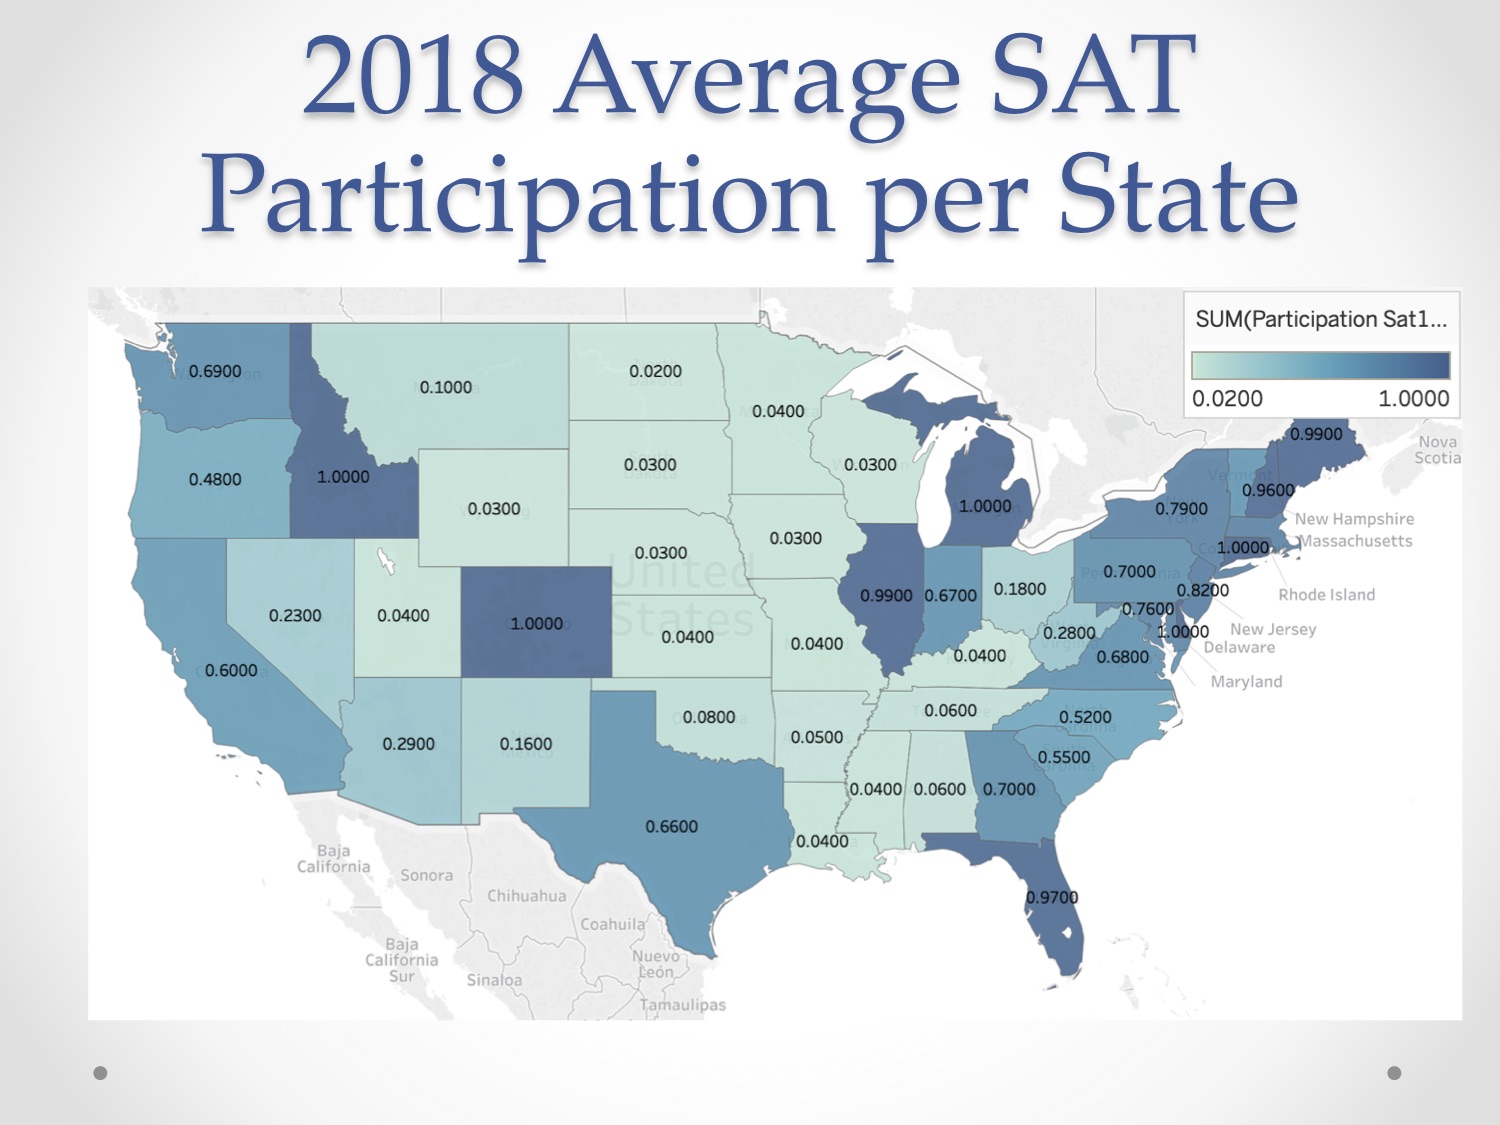
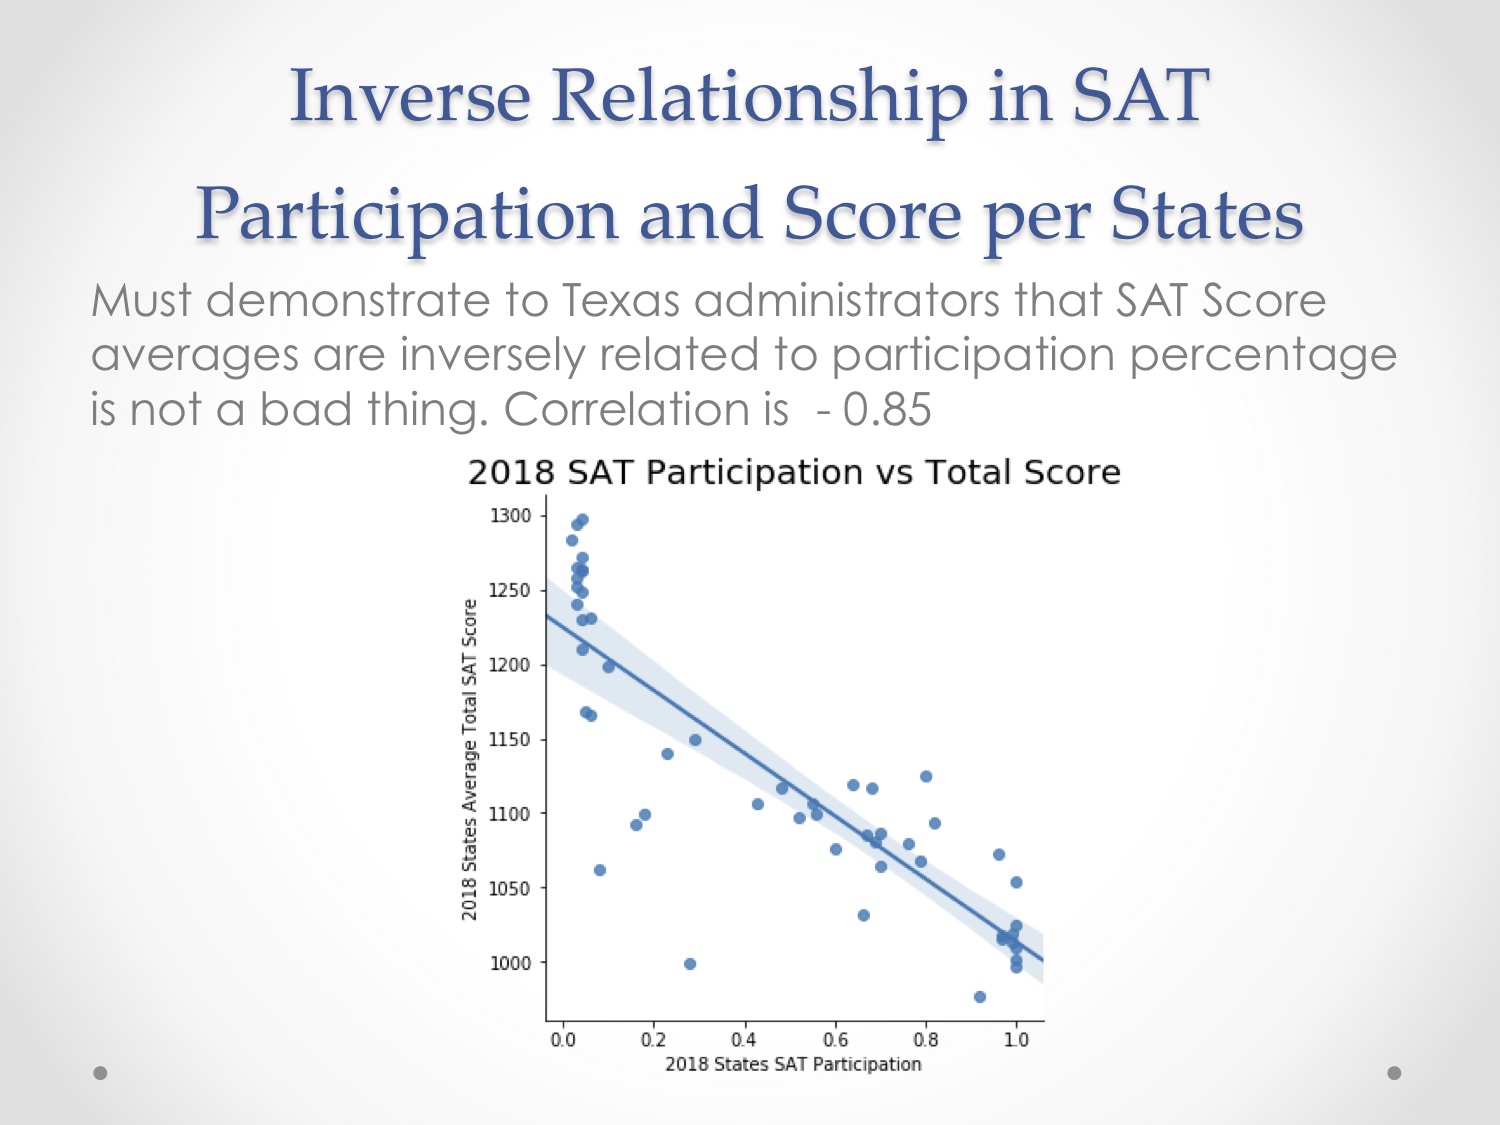
The data we were provided with composed of the average scores of each tests’ sections and the overall composite scores. I cleaned it accordingly, conducted exploratory data analysis on it, used Tableau to visualize the data, and analyzed the data using descriptive and inferential statistics.
My presentation is as follows and the link to the project can be found here on GitHub.